
Aim
The Non-Compliance Management module dashboard allows for centralized monitoring of information related to non-conformities, incidents, and tasks recorded in the system.
This article will present the filter options and the main panels available on the dashboard.
Prerequisites
- The user must have the "View dashboard" permission enabled in the permission group; for more details, click here.

Step by step
1. In the Non-Conformities module , click on the Dashboard tab.
Filters are available at the top of the screen to refine the displayed information.
View filters
At the top of the dashboard, there are filters available that allow you to define which information will be displayed in the panels.

The available filters are:
- Organizational units: allows you to view data related to the selected organizational unit.
- Processes: allows you to view data related to the selected process.
- Source: allows you to view the data according to the selected source.
After selecting your desired filters, click the search button to apply the filters.
Status of non-conformity tasks
This panel displays the number of tasks related to nonconformities, classified according to their status.
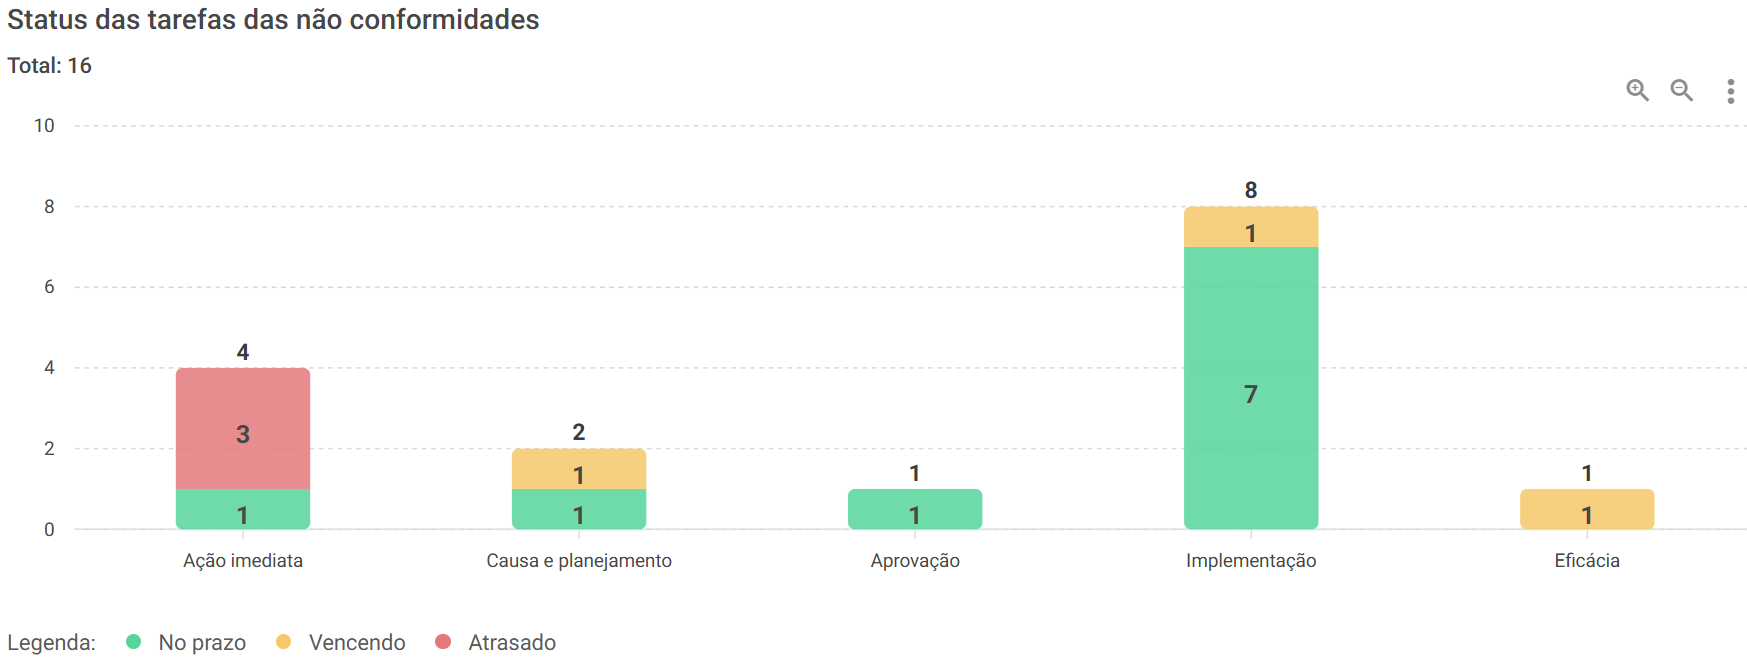
The tasks are presented in the following statuses:
• On time
Winning
• Delayed
The dashboard also displays the total number of tasks according to the applied filters.
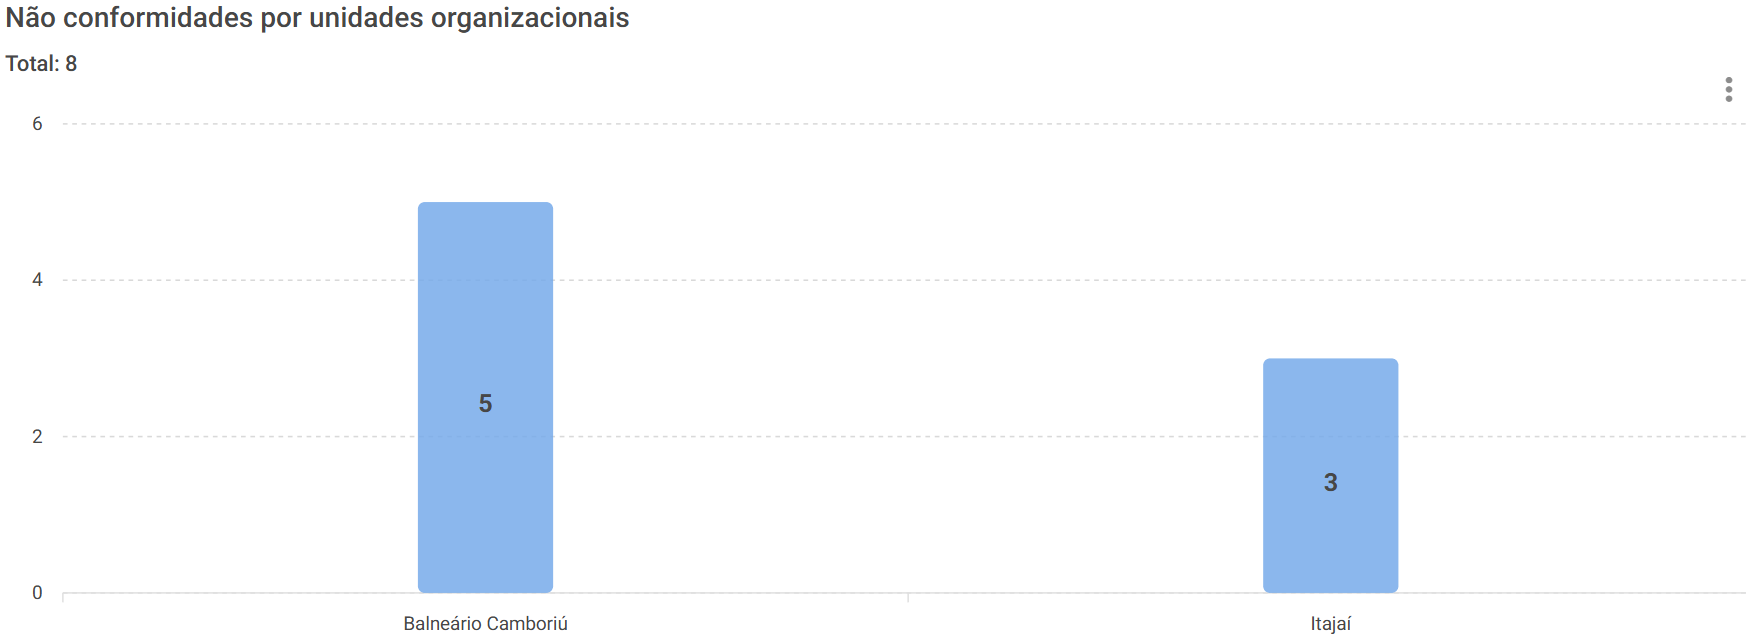
Nonconformities by organizational units:
This panel shows the number of nonconformities distributed across organizational units.
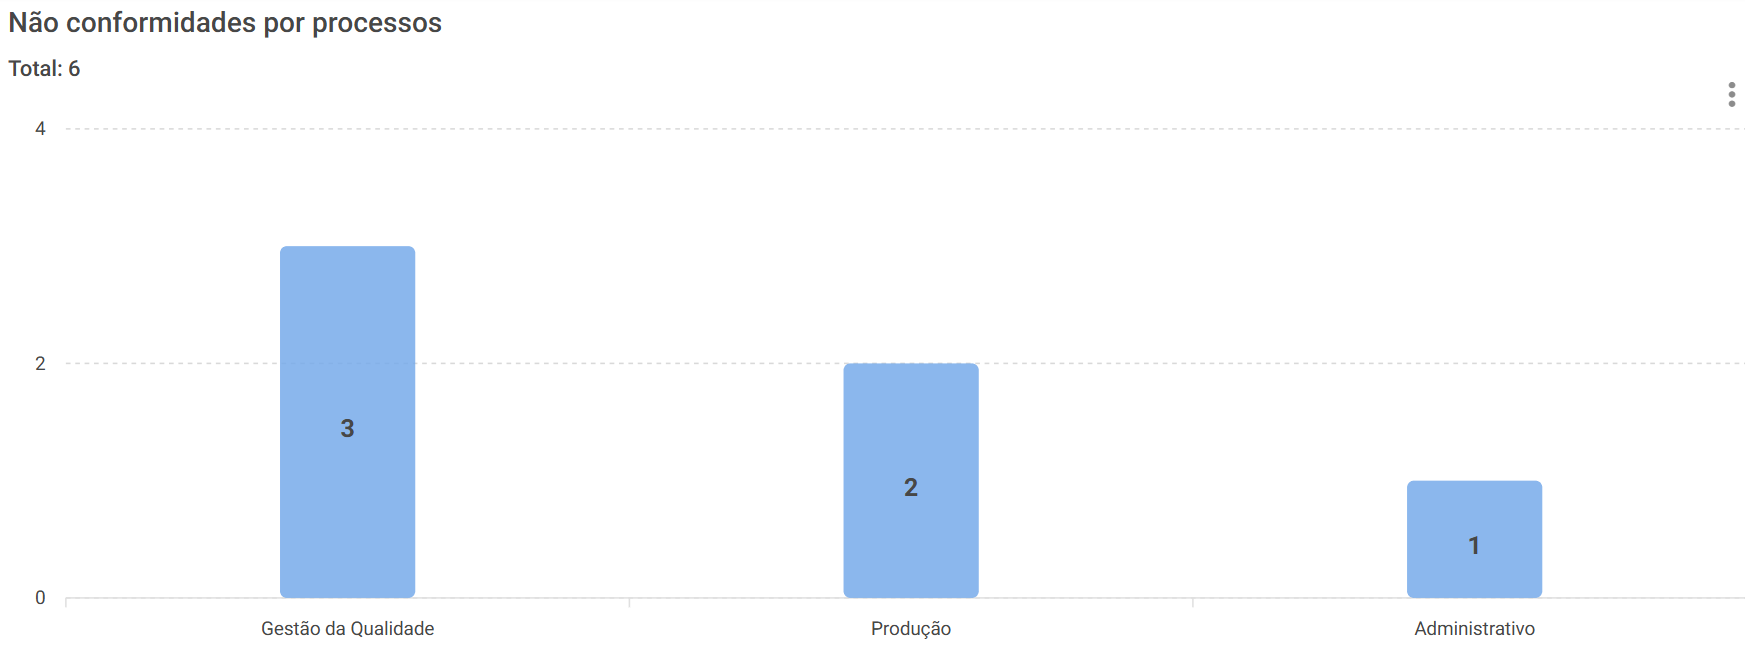
Non-conformities by process
This panel displays the number of nonconformities distributed across processes.
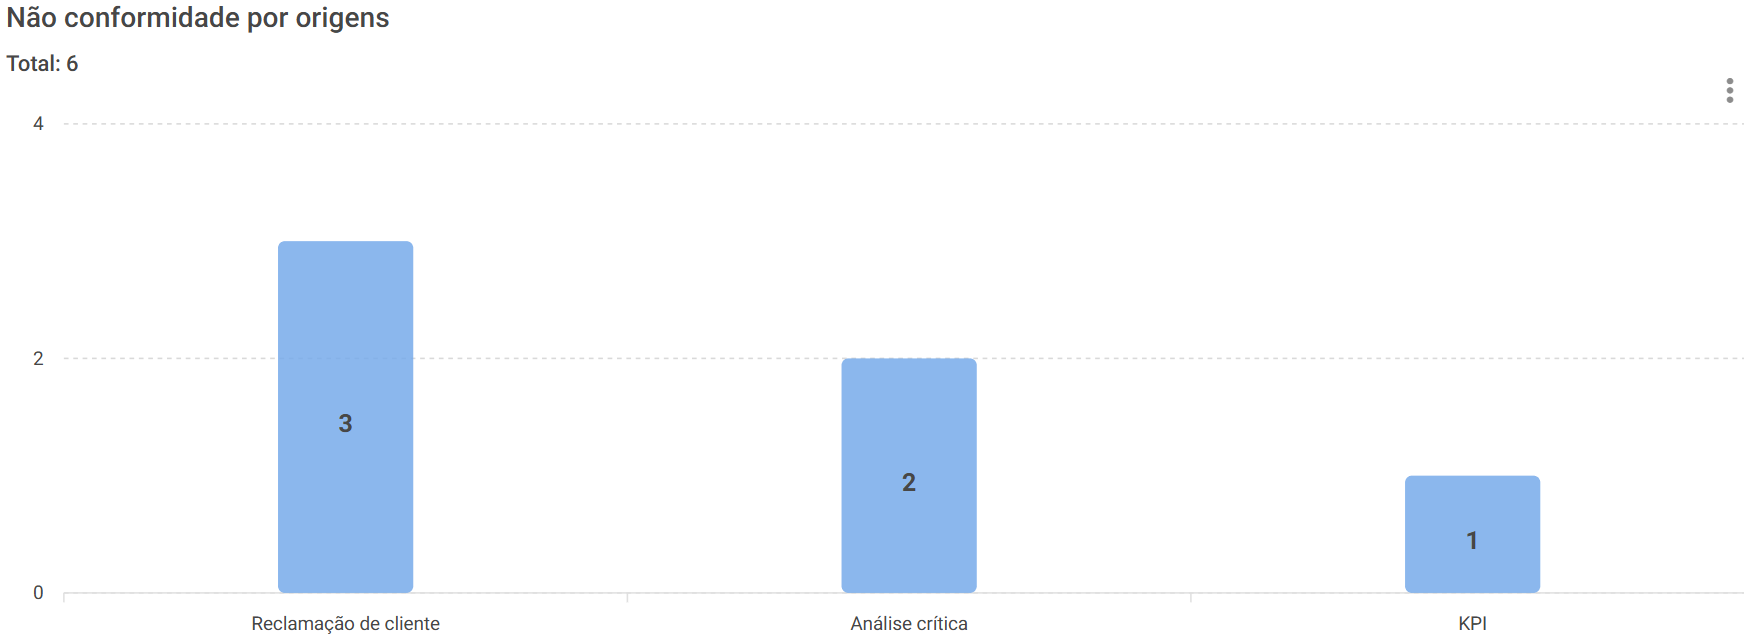
Nonconformities by origin:
This panel displays the number of nonconformities distributed according to their origins.
Non-conformities recorded
This panel displays the number of nonconformities recorded in the system.
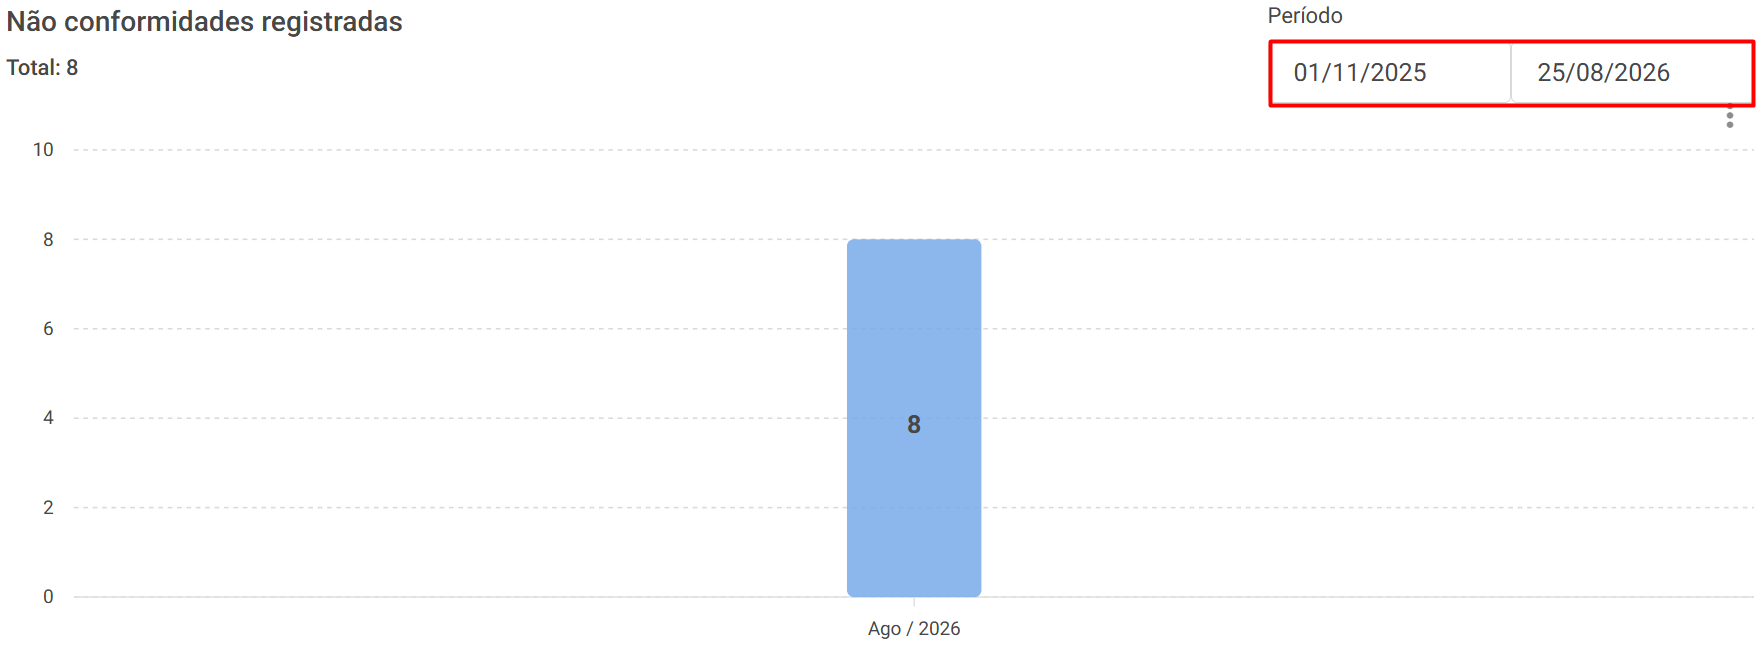
You can use the Period filter to view non-conformities recorded within a specific interval.
Non-conformities due to effectiveness
This panel displays information related to the effectiveness of non-conformities.
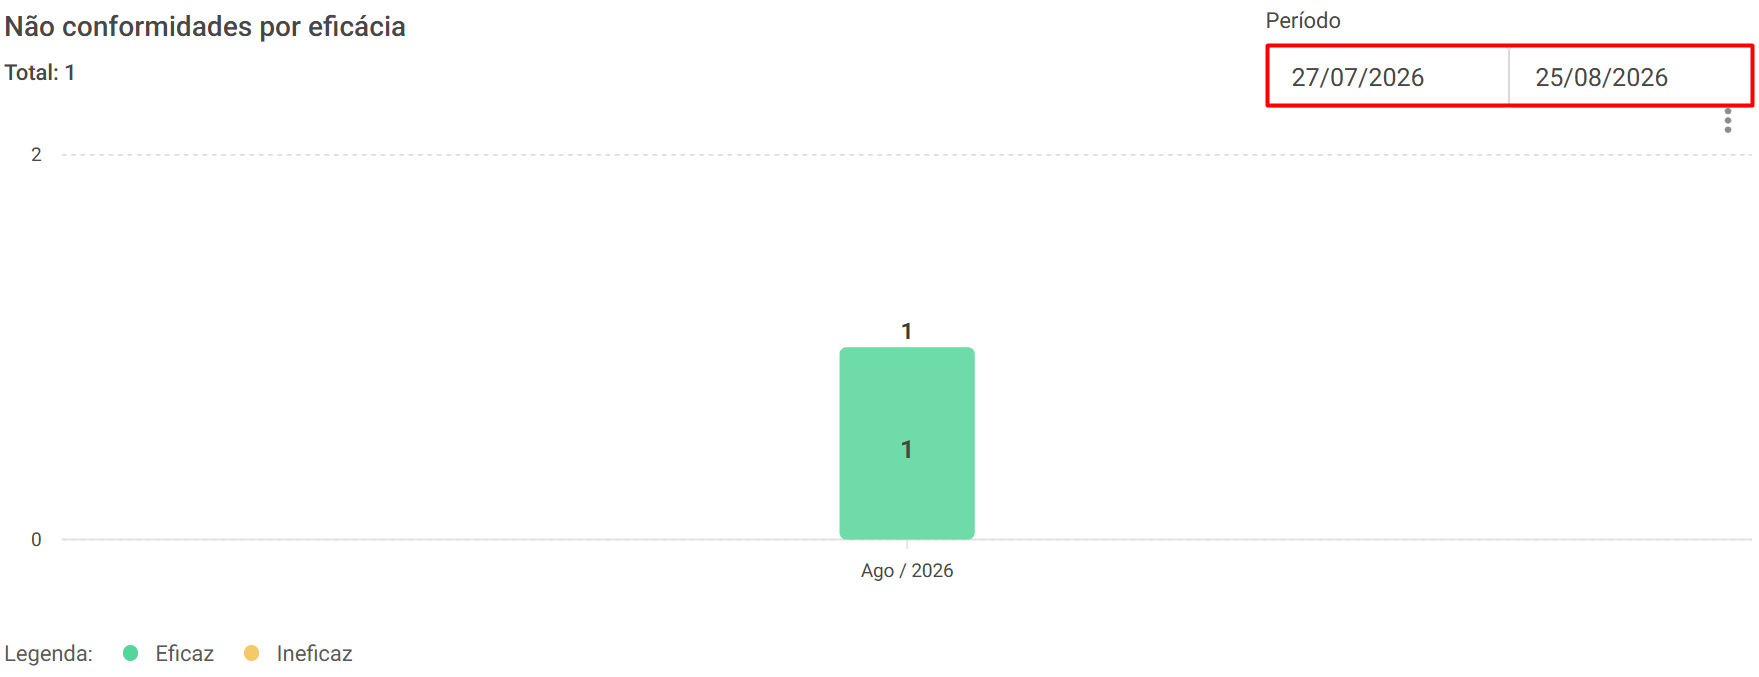
You can use the Period filter to view data from a specific range.
Type of task for the incident
This panel displays the number of tasks related to the incidents, separated by task type.
he types of tasks presented are:
• Take immediate action
• Close incident
Occurrences by organizational units
This panel displays the number of incidents distributed across organizational units.
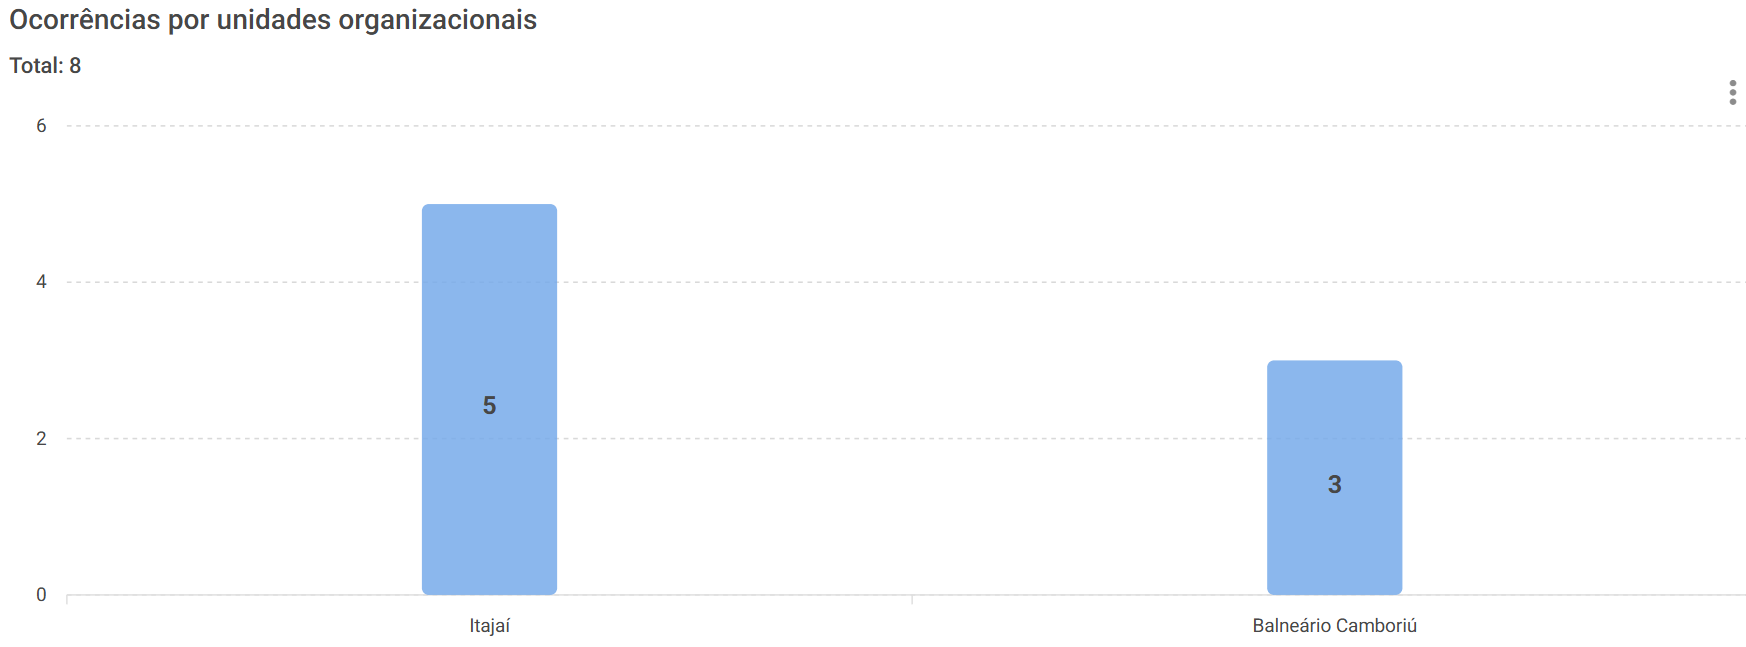
Occurrences by process
This panel displays the number of occurrences distributed across processes.
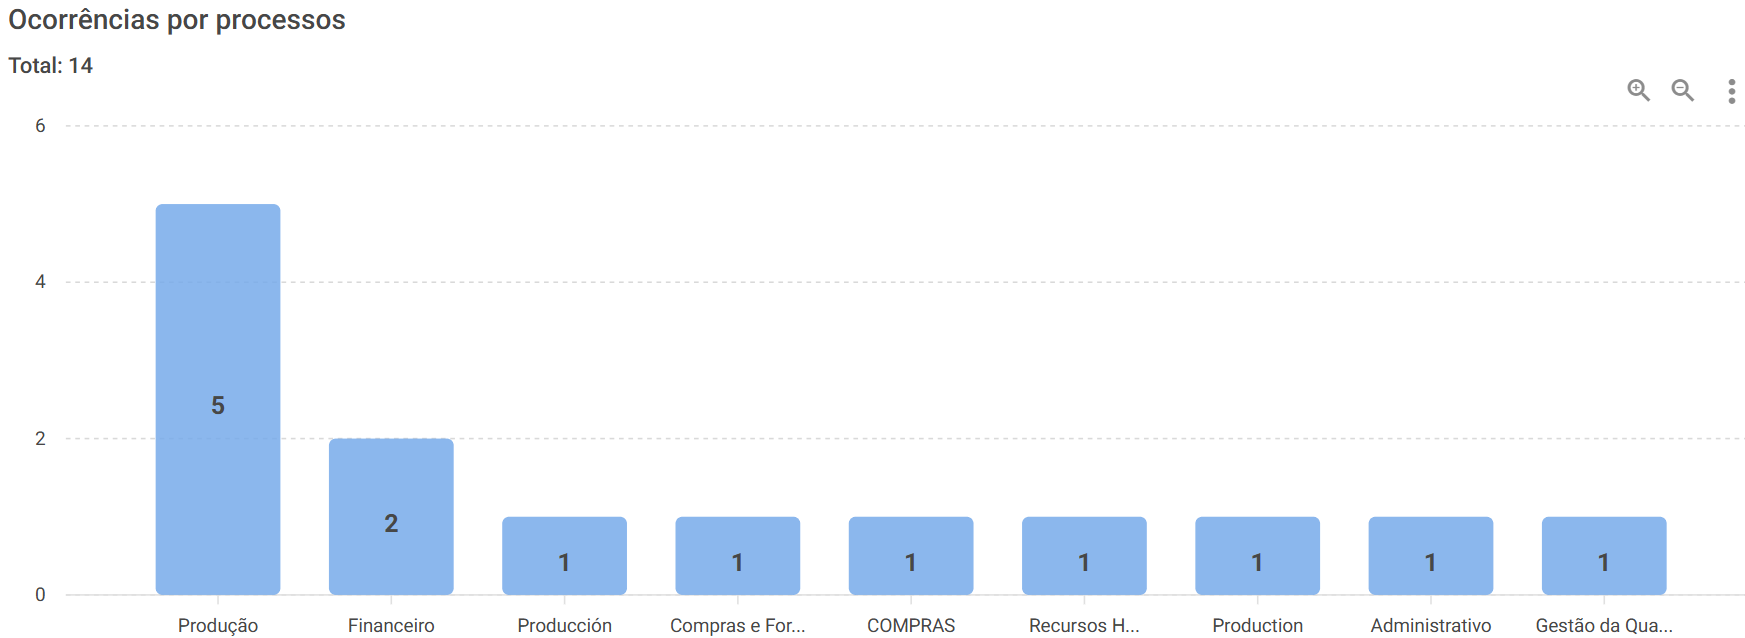
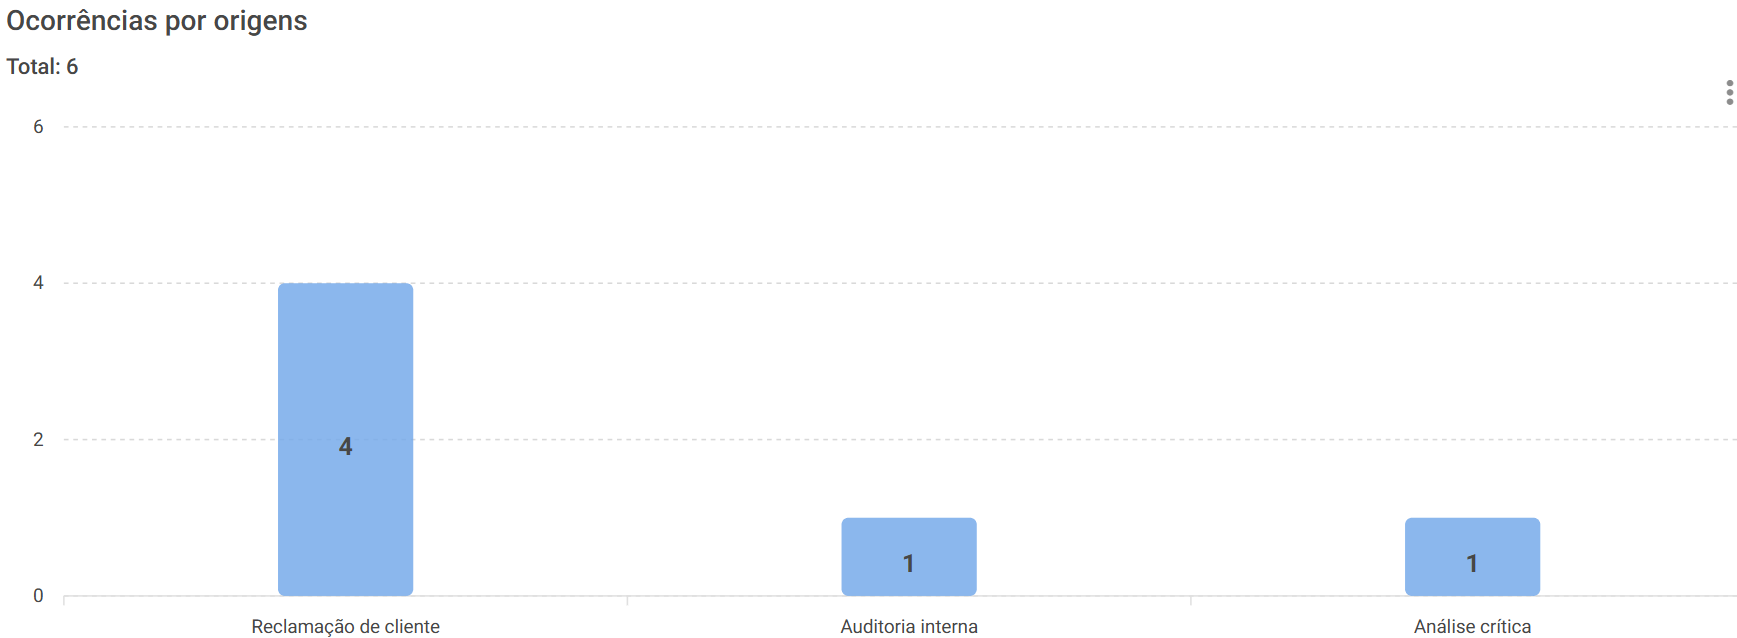
Occurrences by origin
This panel displays the number of occurrences distributed according to their origins.
Incidents recorded and incidents closed.
In these dashboards, it is possible to track indicators of incidents recorded and incidents closed in the system, with the option to apply a filter by period.
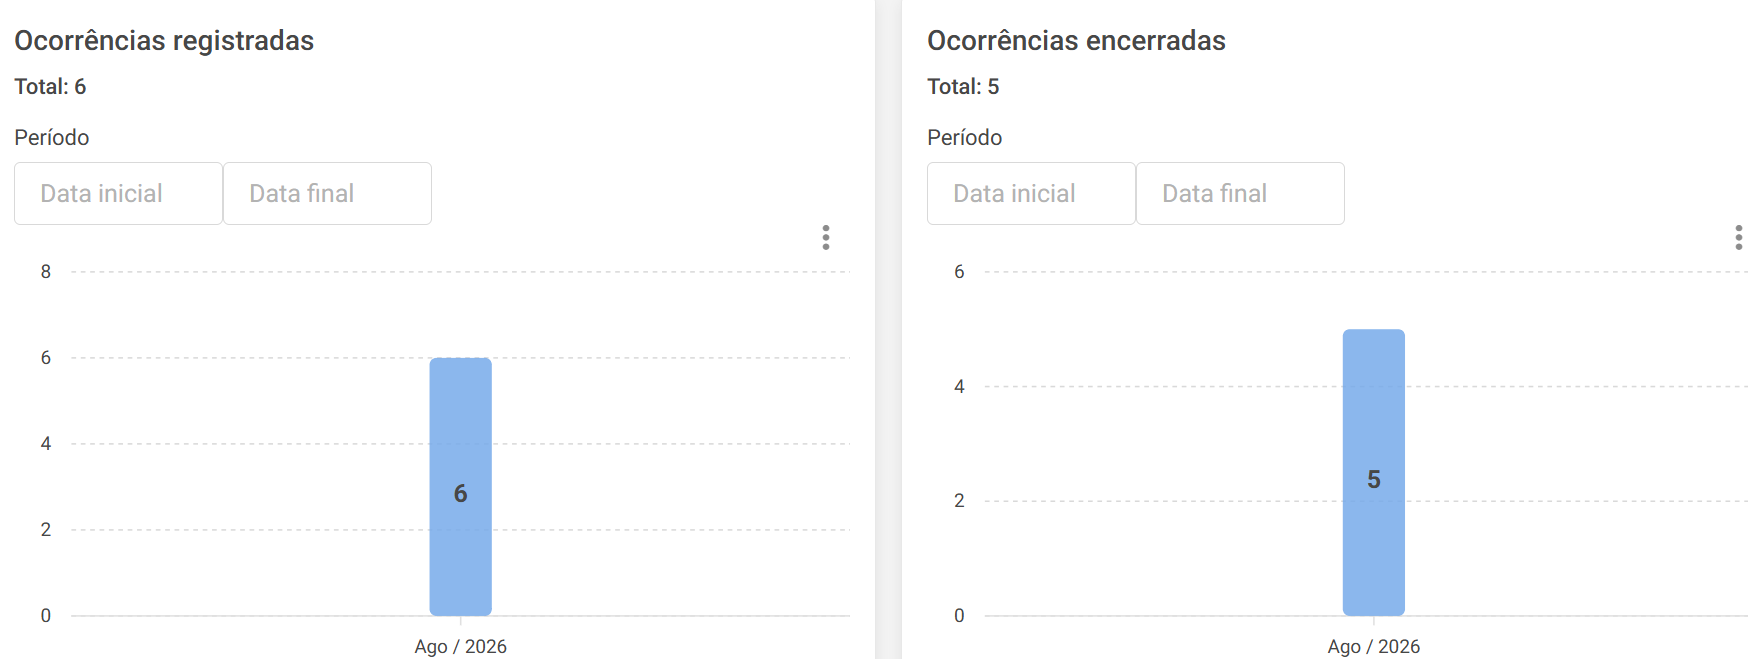
You can use the Period filter to view closed cases within a specific range.
Additional information
By clicking on the columns displayed in the panels, the system directs you to the query screen, allowing you to view the records related to the selected information.
In each of the visualization panels, in the upper right corner, there are several features available to facilitate the visualization and analysis of the data.
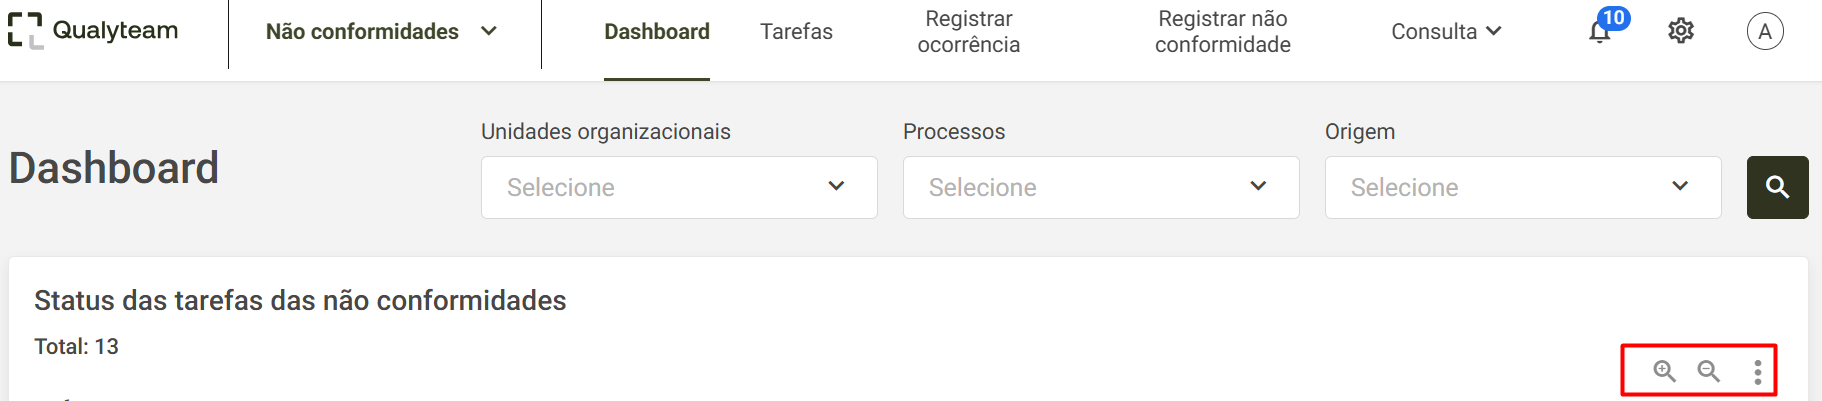
- The magnifying glass with the "+" sign allows you to zoom in on the graph.
- The magnifying glass with the "-" sign allows you to zoom out on the graph.
- The button with the three vertical dots provides options to download the chart in SVG, PNG, or CSV format .
To export a chart, click the three dots and select the desired format.